- 浏览: 1283842 次
- 性别:

- 来自: 北京
-

文章分类
最新评论
-
yaolixing01:
他山界面开发框架 v22是一套基于Gecko v22 的开源收 ...
Mozilla FireFox Gecko内核源代码解析(3.nsScanner) -
夏雪纷纷:
感谢博主的分享,好东西啊,哈哈哈,收走了一些,谢谢啊哦,对了, ...
DevExpress DXperience Universal 11.1.6 下载+源码+编译+汉化流程+升级+替换强名 -
夏雪纷纷:
最近有个对于DXperience 2013新功能发布、重难点技 ...
TextEdit非空验证设置 DXperience学习笔记 -
bosschen:
我自己把问价加密,密码为为123456,是rar文件。然后用各 ...
30秒破解所有密码 -
sword319:
现在才发现为什么自己这么苦逼了...哗哗的全是泪啊.. ...
为什么我们程序员晋升要这么难!
大型网站的监控、报警与故障转移
本章主要从大型网站的后台监控机制、报警机制和故障转移、服务切换等内容来论述。然后给出一个监控、报警和故障转移的解决方案。
1.1 监控预警
现代大型互联网公司主要有电子商务公司、社交网站公司和搜索引擎公司。在电子商务网站公司中,taobao.com的点击量在国内是最高的。日点击量20W以上。而这个点击量还不是均匀分不到24个小时,而是分布在几个时间段。因为人们的购物时间是集中在几个不同的时间段的。这样,平均每小时的点击量更高。在2010年Taobao.com的交易额为300亿元,而平均每分钟交易额为5-10万元。如果taobao.com的服务器宕机一小时,公司的直接损失为300-600万,在交易高峰期可能更多。而在交易高分期,宕机的概率更大,因为服务器的负载在交易高峰期是最高的。由此可见监控和预警在大型网站的日常运营中是非常重要的。
在整个网站的后台架构中,物理设备主要由各种主机和交换设备组成。所以对整个后台系统的监控主要从主机监控和交换设备监控为主。根据监控粒度以及业务需求,需要对应用进程进行监控比如web server 、数据库等。数据库(比如MySQL)监控,如果监控粒度比较大,那么可以从以下几个方面展开监控:
1) 监控连接数
2) 监控时间段慢查询次数
3) 监控查询缓存使用情况
4) 监控主从延迟时间
5) 监控innodb buffer pool size使用情况
6) 监控sql线程和io线程(有replication需求的架构)
7) 监控大结果集查询语句
8) MySQL的存活及data file&log file这些是更基本的
1.2 主机监控
一台主机包含cpu、内存、外设等设备,而cpu、内存、外设由总线相连(SMP架构,NUMA架构监控类似)。如图8-2所示。
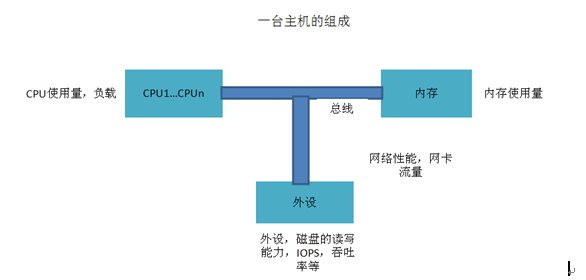
图8-2
如图所示,主机由cpu、外设、内存、总线组成。而一台主机要对外提供访问,需要由网卡提供网络接入。所以对一台主机的监控从cpu、内存、外设以及网卡入手。
常用的监控软件有Nagios、Cacti、Mrtg等。如果公司有需求,可以自己开发相应的绘图软件及数据采集软件完成监控展示、报警和故障转移等功能。下面使用Mrtg再结合shell程序实现监控,给出一个主机监控解决方案。
1.2.1 全方位监控主机
对主机监控,主要从cpu、内存、外设、网卡使用情况及性能进行监控。包括cpu的使用量及空闲量、内存的使用量及空闲量、磁盘的使用量及读写速度、网卡的出入流量等。因为利用Mrtg进行监控,所以之前要安装SNMP和Mrtg软件。
1.2.1.1 cpu监控
主要监控cpu的使用百分比,空闲百分比。在成功安装snmp和mrtg的前提下,主要步骤如下(整个监控项目部署在/root/Desktop/monitor下):
(1)编写shell监控程序 cpuinfo.sh并赋权限为750。
[root@localhost monitor]# cat cpuinfo.sh
#!/bin/bash
#authorlongxibendi
#bloghttp://blog.csdn.net/longxibendi
#functiongetcpu usage information
/usr/bin/sar -u 1 3 > cpu.log
cat cpu.log | grep Average | awk '{ print$3+$5;}'
cat cpu.log | grep Average | awk '{ print$8;}'
/usr/bin/uptime
/sbin/ifconfig | grep "inet addr" |head -n 1 | awk '{print $2;}'
(2配置mrtg的配置文件mrtg.cfg添加以下内容。
Target[localhost_cpu]:`/root/Desktop/monitor/cpuinfo.sh`
Xsize[localhost_cpu]: 300
Ysize[localhost_cpu]: 100
Ytics[localhost_cpu]: 10
MaxBytes[localhost_cpu]: 100
Title[localhost_cpu]: CPU State
PageTop[localhost_cpu]: <H1>CPU StateofServer</H1>
ShortLegend[localhost_cpu]: %
YLegend[localhost_cpu]: CPU (%)
Legend1[localhost_cpu]: Used
Legend2[localhost_cpu]: Total
LegendI[localhost_cpu]: CPU Used
LegendO[localhost_cpu]: CPU IDEL
Options[localhost_cpu]:growright,gauge,nopercent
(3)制作index.html并生成监控数据
indexmaker/etc/mrtg/mrtg.cfg >/var/www/html/index.html
LANG=C LC_ALL=C /usr/bin/mrtg /etc/mrtg/mrtg.cfg
该监控方法是先通过执行程序cpuinfo.sh得到cpu的使用量和空闲量,然后通过mrtg把相应的数据绘画出来,形成图形。结果如图8-2-1-1-1所示。
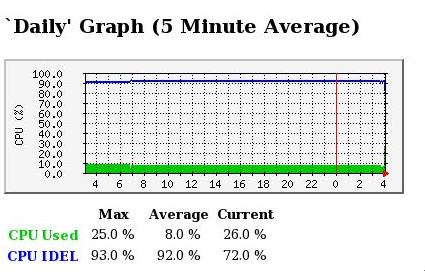
图 8-2-1-1-1
如图8-2-1-1-1所示,在纵坐标中,蓝色线条表示CPU空闲量,绿色线条表示CPU使用量。横坐标为时间轴。改图为一天的CPU使用情况的统计信息。此外MRTG还会统计处一周、一月、一年CPU的使用情况。分别入下图8-2-1-1-2、8-2-1-1-3、8-2-1-1-4所示。
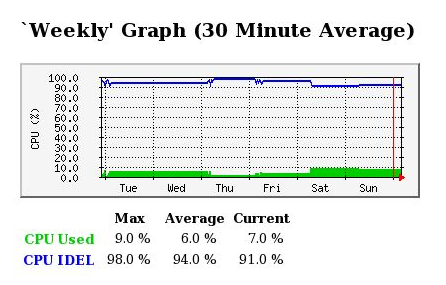
图8-2-1-1-2
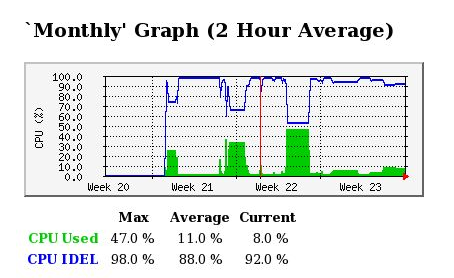
图8-2-1-1-3
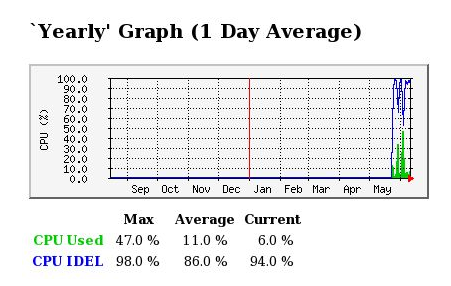
图8-2-1-1-4
1.2.1.2 内存监控
主要监控内存的使用情况,包括内存使用量和空闲量。主要步骤和程序如下:
(1)编写shell监控程序 meminfo.sh并赋权限为750。
[root@localhost monitor]# cat meminfo.sh
#!/bin/bash
#authorlongxibendi
#bloghttp://blog.csdn.net/longxibendi
#functiongetmem usage information
/usr/bin/free | grep Mem > mem.log
cat mem.log | awk ' { print $3;}'
cat mem.log | awk ' { print $2;}'
/usr/bin/uptime
/sbin/ifconfig | grep "inet addr" |head -n 1 | awk '{print $2;}'
(2配置mrtg的配置文件mrtg.cfg添加以下内容。
Target[localhost_mem]:`/root/Desktop/monitor/meminfo.sh`
Xsize[localhost_mem]: 300
Ysize[localhost_mem]: 100
Ytics[localhost_mem]: 10
MaxBytes[localhost_mem]: 4096
Title[localhost_mem]: Memory StateofServer
PageTop[localhost_mem]: <H1>MemoryState of Server</H1>
ShortLegend[localhost_mem]: B
kmg[localhost_mem]: M
YLegend[localhost_mem]: Memory Usage
Legend1[localhost_mem]: Used
Legend2[localhost_mem]: Total
LegendI[localhost_mem]: Used
LegendO[localhost_mem]: Total
Options[localhost_mem]:growright,gauge,nopercent
(3)制作index.html并生成监控数据
indexmaker/etc/mrtg/mrtg.cfg >/var/www/html/index.html
LANG=C LC_ALL=C /usr/bin/mrtg /etc/mrtg/mrtg.cfg
该监控方法是先通过执行程序meminfo.sh得到内存的使用量和空闲量,然后通过mrtg把相应的数据绘画出来,形成图形。结果如图8-2-1-2-1所示。
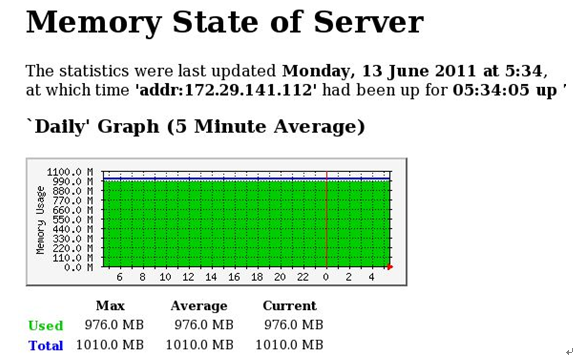
图8-2-1-2-1
如图8-2-1-2-1所示,横坐标表示时间,纵坐标表示内存使用量。其中绿色部分为内存使用量,蓝色部分为内存总量。图8-2-1-2-1为当天内存使用情况。周、月、年的展示图省略。
1.2.1.3 外设磁盘监控
主要监控磁盘的使用情况磁盘,包括磁盘的读出速度和写入速度
主要步骤和程序如下:
(1)编写shell监控程序 ioinfo.sh并赋权限为750。
[root@localhost monitor]# cat ioinfo.sh
#!/bin/bash
#authorlongxibendi
#bloghttp://blog.csdn.net/longxibendi
#functiongetinformationofsda's io
/usr/bin/iostat|grep"sda "> ioinfo.log
cat ioinfo.log | awk ' { print $3;}'
cat ioinfo.log | awk ' { print $4;}'
/usr/bin/uptime
/sbin/ifconfig | grep "inet addr" |head -n 1 | awk '{print $2;}'
(2配置mrtg的配置文件mrtg.cfg添加以下内容。
Target[localhost_io]:`/root/Desktop/monitor/ioinfo.sh`
Xsize[localhost_io]: 300
Ysize[localhost_io]: 100
Ytics[localhost_io]: 10
MaxBytes[localhost_io]: 100
Title[localhost_io]: IO StateofServer
PageTop[localhost_io]: <H1>SDA State ofServer</H1>
ShortLegend[localhost_io]: blocks
YLegend[localhost_io]: Blk_read/s Blk_wrtn/s
Legend1[localhost_io]: Blk_read/s
Legend2[localhost_io]: Blk_wrtn/s
LegendI[localhost_io]: Blk_read/s
LegendO[localhost_io]: Blk_wrtn/s
Options[localhost_io]: growright,gauge,nopercent
(3)制作index.html并生成监控数据
indexmaker/etc/mrtg/mrtg.cfg >/var/www/html/index.html
LANG=C LC_ALL=C /usr/bin/mrtg /etc/mrtg/mrtg.cfg
该监控方法是先通过执行程序ioinfo.sh得到磁盘的读速度和写速度,然后通过mrtg把相应的数据绘画出来,形成图形。结果如图8-2-1-3-1所示。
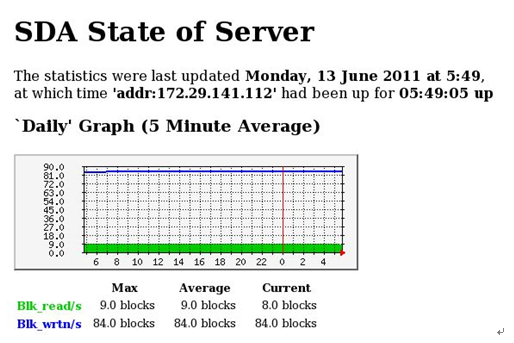
图8-2-1-3-1
如图8-2-1-3-1所示,横坐标表示时间,纵坐标表示磁盘速度。其中绿色部分为磁盘读取速度,蓝色部分为磁盘写入速度。
图8-2-1-3-1为当天磁盘scsi磁盘的第一块分区使用情况,周、月、年展示图省略。如果想增大监控粒度,可以考虑监控inode节点数使用情况。因为节点数不够用也会报错。
1.2.1.4 网卡监控
主要监控网卡的流量,包括网卡的入数据流量和出数据流量
主要步骤和程序如下:
(1) 生成新的MRTG配置文件,通过local登录127.0.0.1,并依据网卡设备名进行数据流量统计,统计的时间轴从右到左推移,并以bit为单位,统计结果保存在/var/www/html中。
cfgmaker --global "WorkDir: /var/www/html" --global"Options[_]: growright,bits" --ifref=name local@127.0.0.1 >/etc/mrtg/mrtg.cfg
(2)通过mrtg.cfg配置文件生成用于http访问的页面文件mrtg.html。
indexmaker /etc/mrtg/mrtg.cfg > /var/www/html/mrtg.html
(3) vi /etc/cron.d/mrtg中输入以下内容
*/1 * * * * root LANG=C LC_ALL=C /usr/bin/mrtg /etc/mrtg/mrtg.cfg--lock-file /var/lock/mrtg/mrtg_l --confcache-file /var/lib/mrtg/mrtg.ok
(4)执行以下内容
LANG=C LC_ALL=C /usr/bin/mrtg /etc/mrtg/mrtg.cfg --lock-file/var/lock/mrtg/mrtg_l --confcache-file /var/lib/mrtg/mrtg.ok
该监控方法用于监控网卡的流量,然后通过mrtg把相应的数据绘画出来,形成图形。结果如图8-2-1-4-1所示。

图8-2-1-4-1
如图4-2-1-4-1所示,横坐标表示时间,纵坐标表示网卡的流量。其中绿色部分表示网卡的入流量,蓝色部分表示网卡的出流量。周、月、年的展示图省略。
1.3 短信报警
随着移动通信设备的普及以及自动化报警的需求,短信报警越来越重要。在企业级应用中,通过购买短信运营商,比如中国联通、中国移动、中国电信的短信网关服务器的服务再结合脚本程序完成短信报警。实际上短信网关服务器起到转换传输通信方式的作用。
1.3.1 短信报警实现
在企业级应用中,通过购买短信运营商的短信网关服务器的服务来转发短信,在下面方案中,我们使用139邮箱绑定手机号码,开通邮件提醒功能,同样实现短信报警。架构图如图8-3-1所示。
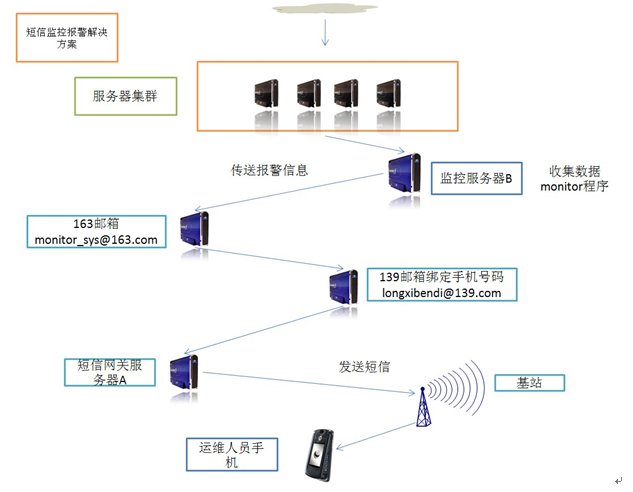
图8-3-1
如图8-3-1所示,节点C为被监控的服务器,节点B为监控系统的服务器,节点A为移动运营商的短信网关服务器。通过脚本程序从C得到监控数据,判读是否大于阈值,如果大于,则将报警信息作为内容通过B上的sendEmail软件将163邮箱作为发送方,发送邮件到139邮箱longxibendi@139.com,然后由于开通邮件短信提醒,移动运营商会将邮件信息转换为短信通过短信网关服务器发送信息到基站,最后传输到手机中。详细信息如下所述。
1.3.1.1 短信报警,监控CPU性能负载
CPU的性能指数,主要查看CPU最近的负载情况,因为CPU某一时刻的使用量达到很大值是可以接受的,但如果某一个时间段负载持续走高,那么CPU的性能以及整个系统的性能将会下降,甚至主机会宕机,停止服务。所以我们编写程序uptime.sh监控CPU负载情况,mail_uptime.sh对CPU的负载进行判断然后执行报警,最后通过cron任务设置执行程序的间隔时间来定时的监控CPU。因为测试原因,暂且把CPU在在一份之内的负载阈值设为0.01,如果超过此数值,则进行短信报警。代码如下。
(1)uptime.sh
#!/bin/bash
#author longxibendi
#blog http://blog.csdn.net/longxibendi
#function to get load
cat/proc/loadavg | awk '
( $1 >= 0.01 ) { print $0;}
(2)mail_uptime.sh
#!/bin/bash
#author longxibendi
#blog http://blog.csdn.net/longxibendi
#function to send mail if system load averages for the past 1 minutes greater than 0.01 .
#ERROR: if you write like this
######################ERROR##################################
##### iftest ! -z " ` sh uptime.sh `" ;then
if test! -z "`shuptime.sh`" ; then
/usr/local/bin/sendEmail-f monitor_sys@163.com -t longxibendi@139.com -s smtp.163.com -u "loadWarning" -xu monitor_sys -xp 123456789 -m " `uptime ` "
fi
1.3.1.2 短信报警,监控CPU使用量
使用程序mail_cpu.sh对CPU的使用量进行监控,CPU的使用量主要包括系统进程(线程)使用量和用户进程使用量。利用sar采集数据,进行判断。sar的一半采集结果如下:
sar–u 1 2
Linux2.6.18-194.el5 (localhost.localdomain) 06/13/2011
07:58:50PM CPU %user%nice %system %iowait%steal %idle
07:58:51PM all 1.000.00 2.00 0.000.00 97.00
07:58:52PM all 0.000.00 0.00 0.000.00 100.00
Average: all 0.500.00 1.01 0.000.00 98.49
程序mail_cpu.sh如下:
#!/bin/bash
#author longxibendi
#blog http://blog.csdn.net/longxibendi
#function email and SMS alert ifusage of cpu is greater than 1%
if[ `/usr/bin/sar -u 1 3 | grepAverage | awk ' { printf( "%d",$3+$5);}'` -ge 1 ] ;then
/usr/local/bin/sendEmail -f monitor_sys@163.com -t longxibendi@139.com-s smtp.163.com -u "cpu warning" -xu monitor_sys -xp 123456789 -m "` /usr/bin/sar -u 1 3 | sed-e '1,2d' -e '4,6d' `" ;
fi
程序mail_cpu.sh当发现cpu使用量超过1%时,进行短信报警。
1.3.1.3 短信报警,监控内存使用量
内存的使用量,是另一个反应当前服务器性能和负载的指标。使用free.sh对内存使用量进行采集,使用mail_free.sh对内存的使用量进行监控,实现短信报警。具体程序如下:
free.sh程序
#!/bin/bash
#author longxibendi
#blog http://blog.csdn.net/longxibendi
#function get the percentage of memory usage
fr="`free`";
free| grep Mem | awk -vf="$fr" '
($3/$2 >= 0.5) {print f ;}
'
unsetfr
mail_free.sh程序
#!/bin/bash
#author longxibendi
#blog http://blog.csdn.net/longxibendi
#function to send email to longxibendi@139.com ifthe percentage of memoryusage greater than or equal
iftest ! -z "`sh free.sh`" ;then
/usr/local/bin/sendEmail-f monitor_sys@163.com -t longxibendi@139.com -s smtp.163.com -u "memorywarnning" -xu monitor_sys -xp 123456789 -m "` sh free.sh| awk -va="****" ' { print $1,a,$2,a,$3,a,$4,a,$5,a,$6;}'`"
Fi
1.3.1.4 短信报警,监控磁盘使用量
主要对磁盘的分区使用量进行监控,通过程序df.sh对磁盘使用量进行数据收集,通过mail_df.sh对df.sh收集的数据进行分析,如果发现超过阈值,进行短信报警。设置的阈值为70%。即磁盘分区使用量超过70%进行报警。程序如下。
df.sh程序
#!/bin/bash
#author longxibendi
#blog http://blog.csdn.net/longxibendi
#function findwhich disk‘s Available amount less than20%
df -hm |awk '
( $3/$2 >= 0.7 ) { printf "%s\n" ,$0; }
'
mail_df.sh程序
#!/bin/bash
#author longxibendi
#blog http://blog.csdn.net/longxibendi
#function sendmail to longxibendi@139.com ifthe amount of available disk less than 20%
#if[ `./df.sh | wc -l ` >=1 ] ; then
if [ `./df.sh | wc -l ` > 0 ] ; then
/usr/local/bin/sendEmail -f monitor_sys@163.com -t longxibendi@139.com-s smtp.163.com -u "disk warning" -xu monitor_sys -xp 123456789 -m "`./df.sh | awk ' { print $5,$6}' ; date ` "
fi
1.3.1.5 短信报警,监控磁盘的读写速度
读速度监控以及短信报警,使用程序mail_io_read.sh。当发现磁盘读速度小于每秒100Blocks时,执行短信报警。程序如下。
mail_io_read.sh程序
#!/bin/bash
#author longxibendi
#blog http://blog.csdn.net/longxibendi
#function SMS and Email alertif IO error
if[ `/usr/bin/iostat | grep sda | head -n 1 | awk '{printf("%d",$3);}'`-le 100 ] ;then
/usr/local/bin/sendEmail -f monitor_sys@163.com -t longxibendi@139.com-s smtp.163.com -u "IO warning" -xu monitor_sys -xp 123456789 -m " `iostat | sed -e '1,5d' -e '8,21d'|awk -v a="||" '{print $1,a,$2,a,$3,a,$4,a,$5,a,$6;}
'`";
fi
写速度监控以及短信报警,使用程序mail_io_write.sh。当发现磁盘写速度小于每秒100Blocks时,执行短信报警。程序如下
mail_io_write.sh程序
#!/bin/bash
#author longxibendi
#blog http://blog.csdn.net/longxibendi
#function SMS and Email alertif IO error
if[ `/usr/bin/iostat | grep sda | head -n 1 | awk '{printf("%d",$4);}'`-le 100 ] ;then
/usr/local/bin/sendEmail -f monitor_sys@163.com -t longxibendi@139.com-s smtp.163.com -u "IO warning" -xu monitor_sys -xp 123456789 -m "`iostat | sed -e '1,5d' -e '8,21d'|awk -v a="||" '{print $1,a,$2,a,$3,a,$4,a,$5,a,$6;}
'`";
fi
1.3.1.6 短信报警,监控网卡的状态
提供网络服务器的服务器,必须有网卡,一旦网卡出现问题,如果只有一块出口网卡,那么预示着本机的服务也终止了。所以网卡的监控非常重要。下面使用mail_eth0.sh对网卡进行状态监控。程序如下。
mail_eth0.sh
!/bin/bash
#author longxibendi
#blog http://blog.csdn.net/longxibendi
#function SMS and Email alert
if[ `sar -n DEV 1 1 | grep Average | sed -e '2d' -e '4d' | tail -n 1 | awk'{printf("%d",$5);}'` -eq 0];then
/usr/local/bin/sendEmail -f monitor_sys@163.com -t longxibendi@139.com-s smtp.163.com -u "eth0 error" -xu monitor_sys -xp 123456789 -m "`date `" ;
fi
1.4 故障转移
故障转移是指,当一个节点或者一个服务发生故障,比如主机僵死,进程僵死之后,能够有相应的监控系统发现故障,并在较短的时间内启动备用机器,实现故障转移。这是保证大型网站的高可用性最为重要的措施和方法之一。故障转移有不同的几个级别,比如主机操作系统的故障转移,数据库的故障转移,应用进程的故障转移等。本节主要给出应用进程的故障转移,以检测Nginx进程为例。
1.4.1 WebServer故障转移解决方案
运行环境如图8-4-1所示。
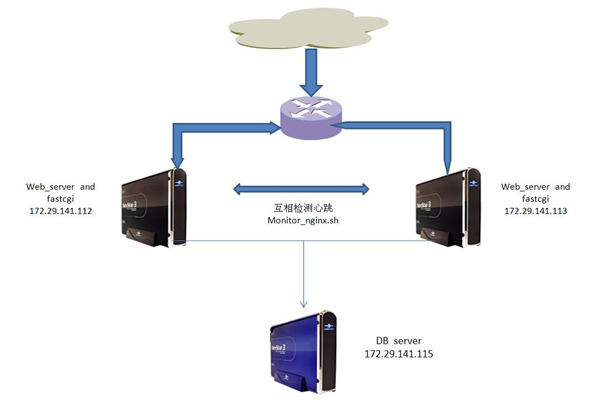
图8-4-1
如图8-4-1所示,在IP:172.29.141.112和172.29.141.113上同时部署两个web server Nginx服务器,并且部署故障转移程序monitor_nginx程序互相监控对方的Nginx运行情况。当发现另一方的Nginx服务器停止之后,立刻更改本机IP为对方IP,发送短信报警然后启用本机的Nginx程序来提供服务。详细部署情况如下所示:
172.29.141.112 部署 Nginx 与 FastCGI(对外开放)
172.29.141.113 部署 Nginx 与 FastCGI(作为热备)
172.29.141.115 部署 MySQL(或者MySQL-Proxy)
1.4.1.1 monitor_nginx程序
monitor_nginx程序如下:
#!/bin/bash
#author longxibendi
#blog http://blog.csdn.net/longxibendi
#function failoverthe web server andsend message to SA
# send emailto longxibendi@139.com
function_sendEmail()
{
/usr/local/bin/sendEmail -f monitor_sys@163.com -t longxibendi@139.com-s smtp.163.com -u "web sever down" -xu monitor_sys -xp123456789 -m "` date ` "
}
# changeip address
function_change_ip()
{
/sbin/ifconfig eth0 172.29.141.112 broadcast 172.29.141.255 netmask 255.255.255.0 up
/sbin/route add-host 172.29.141.112 dev eth0
/sbin/arping -Ieth0 -c 3-s 172.29.141.112 172.29.141.115
###/sbin/arping is toadd arp list in172.29.141.115
}
# tostart local nginxweb server
function_start_nginx_server()
{
ulimit -SHn 65535
/usr/local/webserver/php/sbin/php-fpmstart
/usr/local/webserver/nginx/sbin/nginx
}
#main function
function_main()
{
while true
do
http_status_code=`curl -o /dev/null -s -w %{http_code} http://172.29.141.112/wordpress/`
# echo "$http_status_code";
if [${http_status_code} != 200 ];then
function_sendEmail ;
function_change_ip ;
function_start_nginx_server;
fi
#execute curl per3 seconds
sleep3
done
}
function_main;
1.4.1.2 monitor程序说明
程序说明:
unction_sendEmail发送email到139邮箱,报警
function_change_ip浮动更改ip,添加路由,修改db的arp表
function_start_nginx_server 启动本机nginx服务器,这一步也可以调整,如果本机的nginx已启动的话
function_main主函数,通过curl网址得到状态码
1.4.1.3 monitor_nginx程序算法
基本算法
1.通过curl检测故障
2.通过浮动修改(ifconfig)ip实现故障切换(failover)
1.5 主机节点监控(宕机检测与报警)
一台主机除了对其CPU、内存、外设、网卡进行监控报警,更需要对整个主机进行监控,这个监控报警主要是监控主机是否在运行。宕机对运维人员来说,最痛苦了。如何检测一台服务器是否还在正常运行,如果该服务器宕机,如何在第一时间监测到并通知一线运维人员进行维护,最大化减少损失。下面的程序monitor_down.sh就是解决上述问题。
1.5.1 monitor_down.sh程序
monitor_down.sh程序如下。
#!/bin/bash
#author longxibendi
#blog http://blog.csdn.net/longxibendi
#function pinga host andoutput to fileping_longxibendi.log
#ping destination
function_ping()
{
ping -c3 172.29.141.115 >ping_longxibendi.log
}
#downtimedetection and send email to SA
function_downtime_detection_AND_sendemail()
{
if ["`cat ping_longxibendi.log | grep Unreachable`" !="" ] ; then
/usr/local/bin/sendEmail -fmonitor_sys@163.com -t longxibendi@139.com -s smtp.163.com -u "Serverdowntime" -xu monitor_sys -xp 123456789 -m "`date;echo"172.29.141.115" ` "
fi
}
#mainfunction
function_main()
{
while true
do
function_ping ;
sleep2
function_downtime_detection_AND_sendemail;
sleep2
done
}
function_main;
1.5.1.1 程序说明
(1)通过function_ping,每隔4秒对 主机 172.29.141.115 进行ping 操作,(当然,如果主机172.29.141.115的防火墙,或者内过滤ICMP包,那么这个程序显然不能用)将输出重定向到ping_longxibendi.log 文件中。
(2)通过function_downtime_detection_AND_sendemail,每隔4秒,通过ping_longxibendi.log判断是否有没有ping通的迹象,如果有,则调用 sendEmail 邮件(手机短信)报警。
(3)监控间隔时间说明,可以将第一个sleep 改为150,第二个sleep改为150,这样每隔5分钟监控一次。
1.5.1.2 程序扩展
在上面的程序基础上,根据应用需求,进行相应的代码添加,可以实现故障转移、服务器切换功能。具体方法与8.4.1节类似。
1.6 MySQL数据库监控
数据库的重要性对企业来书,不言而喻,一旦数据库出现问题,上层的应用服务将不能进行。所以对数据库的监控报警至关重要。根据企业的应用不同,监控粒度也有所不同,比如,监控MySQL的运行情况,监控MySQL数据库的缓存使用情况,监控MySQL的查询线程使用情况等。实现MySQL运行状态监控报警程序mail_mysql.sh。
1.6.1 mail_mysql.sh程序
mail_mysql.sh程序如下。
#!/bin/bash
#author longxibendi
#blog http://blog.csdn.net/longxibendi
#function monitoringmysql
SS=`/usr/local/webserver/mysql/bin/mysql -uadmin -p12345678 -h 172.29.141.112 -P3306 -e "show databases;" 2> /dev/null`
if[ -z "$SS" ]; then
/usr/local/bin/sendEmail -f monitor_sys@163.com -t longxibendi@139.com-s smtp.163.com -u "MySQL Down" -xu monitor_sys -xp 123456789 -m "`date `";
fi
1.6.1.1 mail_mysql.sh程序说明
通过使用mysql –e 参数执行 mysql命令,(把错误输出重定向到/dev/null)如果得到结果,则说明MySQL服务器正常运行,如果没有得到结果,或者得到结果为空,则说明MySQL数据库有问题。发送短信报警信息。
1.6.1.2 程序扩展
在高可用的网站后台中,会用到MySQL的主从复制,这样如果发现主数据库出现问题,通过更改本程序,可以实现故障转移。基本方法与1.4.1类似。
1.7 本章小结
本章主要详细论述了三个问题:服务器的监控、报警与故障转移。通过shell程序结合mrtg绘图工具,实现了一个完整的监控主机的方案。通过shell程序结合网易和移动的邮箱服务,实现了一个完整的短信报警方案。通过shell程序实现了故障转移的方案。
本章主要从大型网站的后台监控机制、报警机制和故障转移、服务切换等内容来论述。然后给出一个监控、报警和故障转移的解决方案。
1.1 监控预警
现代大型互联网公司主要有电子商务公司、社交网站公司和搜索引擎公司。在电子商务网站公司中,taobao.com的点击量在国内是最高的。日点击量20W以上。而这个点击量还不是均匀分不到24个小时,而是分布在几个时间段。因为人们的购物时间是集中在几个不同的时间段的。这样,平均每小时的点击量更高。在2010年Taobao.com的交易额为300亿元,而平均每分钟交易额为5-10万元。如果taobao.com的服务器宕机一小时,公司的直接损失为300-600万,在交易高峰期可能更多。而在交易高分期,宕机的概率更大,因为服务器的负载在交易高峰期是最高的。由此可见监控和预警在大型网站的日常运营中是非常重要的。
在整个网站的后台架构中,物理设备主要由各种主机和交换设备组成。所以对整个后台系统的监控主要从主机监控和交换设备监控为主。根据监控粒度以及业务需求,需要对应用进程进行监控比如web server 、数据库等。数据库(比如MySQL)监控,如果监控粒度比较大,那么可以从以下几个方面展开监控:
1) 监控连接数
2) 监控时间段慢查询次数
3) 监控查询缓存使用情况
4) 监控主从延迟时间
5) 监控innodb buffer pool size使用情况
6) 监控sql线程和io线程(有replication需求的架构)
7) 监控大结果集查询语句
8) MySQL的存活及data file&log file这些是更基本的
1.2 主机监控
一台主机包含cpu、内存、外设等设备,而cpu、内存、外设由总线相连(SMP架构,NUMA架构监控类似)。如图8-2所示。
图8-2
如图所示,主机由cpu、外设、内存、总线组成。而一台主机要对外提供访问,需要由网卡提供网络接入。所以对一台主机的监控从cpu、内存、外设以及网卡入手。
常用的监控软件有Nagios、Cacti、Mrtg等。如果公司有需求,可以自己开发相应的绘图软件及数据采集软件完成监控展示、报警和故障转移等功能。下面使用Mrtg再结合shell程序实现监控,给出一个主机监控解决方案。
1.2.1 全方位监控主机
对主机监控,主要从cpu、内存、外设、网卡使用情况及性能进行监控。包括cpu的使用量及空闲量、内存的使用量及空闲量、磁盘的使用量及读写速度、网卡的出入流量等。因为利用Mrtg进行监控,所以之前要安装SNMP和Mrtg软件。
1.2.1.1 cpu监控
主要监控cpu的使用百分比,空闲百分比。在成功安装snmp和mrtg的前提下,主要步骤如下(整个监控项目部署在/root/Desktop/monitor下):
(1)编写shell监控程序 cpuinfo.sh并赋权限为750。
[root@localhost monitor]# cat cpuinfo.sh
#!/bin/bash
#authorlongxibendi
#bloghttp://blog.csdn.net/longxibendi
#functiongetcpu usage information
/usr/bin/sar -u 1 3 > cpu.log
cat cpu.log | grep Average | awk '{ print$3+$5;}'
cat cpu.log | grep Average | awk '{ print$8;}'
/usr/bin/uptime
/sbin/ifconfig | grep "inet addr" |head -n 1 | awk '{print $2;}'
(2配置mrtg的配置文件mrtg.cfg添加以下内容。
Target[localhost_cpu]:`/root/Desktop/monitor/cpuinfo.sh`
Xsize[localhost_cpu]: 300
Ysize[localhost_cpu]: 100
Ytics[localhost_cpu]: 10
MaxBytes[localhost_cpu]: 100
Title[localhost_cpu]: CPU State
PageTop[localhost_cpu]: <H1>CPU StateofServer</H1>
ShortLegend[localhost_cpu]: %
YLegend[localhost_cpu]: CPU (%)
Legend1[localhost_cpu]: Used
Legend2[localhost_cpu]: Total
LegendI[localhost_cpu]: CPU Used
LegendO[localhost_cpu]: CPU IDEL
Options[localhost_cpu]:growright,gauge,nopercent
(3)制作index.html并生成监控数据
indexmaker/etc/mrtg/mrtg.cfg >/var/www/html/index.html
LANG=C LC_ALL=C /usr/bin/mrtg /etc/mrtg/mrtg.cfg
该监控方法是先通过执行程序cpuinfo.sh得到cpu的使用量和空闲量,然后通过mrtg把相应的数据绘画出来,形成图形。结果如图8-2-1-1-1所示。
图 8-2-1-1-1
如图8-2-1-1-1所示,在纵坐标中,蓝色线条表示CPU空闲量,绿色线条表示CPU使用量。横坐标为时间轴。改图为一天的CPU使用情况的统计信息。此外MRTG还会统计处一周、一月、一年CPU的使用情况。分别入下图8-2-1-1-2、8-2-1-1-3、8-2-1-1-4所示。
图8-2-1-1-2
图8-2-1-1-3
图8-2-1-1-4
1.2.1.2 内存监控
主要监控内存的使用情况,包括内存使用量和空闲量。主要步骤和程序如下:
(1)编写shell监控程序 meminfo.sh并赋权限为750。
[root@localhost monitor]# cat meminfo.sh
#!/bin/bash
#authorlongxibendi
#bloghttp://blog.csdn.net/longxibendi
#functiongetmem usage information
/usr/bin/free | grep Mem > mem.log
cat mem.log | awk ' { print $3;}'
cat mem.log | awk ' { print $2;}'
/usr/bin/uptime
/sbin/ifconfig | grep "inet addr" |head -n 1 | awk '{print $2;}'
(2配置mrtg的配置文件mrtg.cfg添加以下内容。
Target[localhost_mem]:`/root/Desktop/monitor/meminfo.sh`
Xsize[localhost_mem]: 300
Ysize[localhost_mem]: 100
Ytics[localhost_mem]: 10
MaxBytes[localhost_mem]: 4096
Title[localhost_mem]: Memory StateofServer
PageTop[localhost_mem]: <H1>MemoryState of Server</H1>
ShortLegend[localhost_mem]: B
kmg[localhost_mem]: M
YLegend[localhost_mem]: Memory Usage
Legend1[localhost_mem]: Used
Legend2[localhost_mem]: Total
LegendI[localhost_mem]: Used
LegendO[localhost_mem]: Total
Options[localhost_mem]:growright,gauge,nopercent
(3)制作index.html并生成监控数据
indexmaker/etc/mrtg/mrtg.cfg >/var/www/html/index.html
LANG=C LC_ALL=C /usr/bin/mrtg /etc/mrtg/mrtg.cfg
该监控方法是先通过执行程序meminfo.sh得到内存的使用量和空闲量,然后通过mrtg把相应的数据绘画出来,形成图形。结果如图8-2-1-2-1所示。
图8-2-1-2-1
如图8-2-1-2-1所示,横坐标表示时间,纵坐标表示内存使用量。其中绿色部分为内存使用量,蓝色部分为内存总量。图8-2-1-2-1为当天内存使用情况。周、月、年的展示图省略。
1.2.1.3 外设磁盘监控
主要监控磁盘的使用情况磁盘,包括磁盘的读出速度和写入速度
主要步骤和程序如下:
(1)编写shell监控程序 ioinfo.sh并赋权限为750。
[root@localhost monitor]# cat ioinfo.sh
#!/bin/bash
#authorlongxibendi
#bloghttp://blog.csdn.net/longxibendi
#functiongetinformationofsda's io
/usr/bin/iostat|grep"sda "> ioinfo.log
cat ioinfo.log | awk ' { print $3;}'
cat ioinfo.log | awk ' { print $4;}'
/usr/bin/uptime
/sbin/ifconfig | grep "inet addr" |head -n 1 | awk '{print $2;}'
(2配置mrtg的配置文件mrtg.cfg添加以下内容。
Target[localhost_io]:`/root/Desktop/monitor/ioinfo.sh`
Xsize[localhost_io]: 300
Ysize[localhost_io]: 100
Ytics[localhost_io]: 10
MaxBytes[localhost_io]: 100
Title[localhost_io]: IO StateofServer
PageTop[localhost_io]: <H1>SDA State ofServer</H1>
ShortLegend[localhost_io]: blocks
YLegend[localhost_io]: Blk_read/s Blk_wrtn/s
Legend1[localhost_io]: Blk_read/s
Legend2[localhost_io]: Blk_wrtn/s
LegendI[localhost_io]: Blk_read/s
LegendO[localhost_io]: Blk_wrtn/s
Options[localhost_io]: growright,gauge,nopercent
(3)制作index.html并生成监控数据
indexmaker/etc/mrtg/mrtg.cfg >/var/www/html/index.html
LANG=C LC_ALL=C /usr/bin/mrtg /etc/mrtg/mrtg.cfg
该监控方法是先通过执行程序ioinfo.sh得到磁盘的读速度和写速度,然后通过mrtg把相应的数据绘画出来,形成图形。结果如图8-2-1-3-1所示。
图8-2-1-3-1
如图8-2-1-3-1所示,横坐标表示时间,纵坐标表示磁盘速度。其中绿色部分为磁盘读取速度,蓝色部分为磁盘写入速度。
图8-2-1-3-1为当天磁盘scsi磁盘的第一块分区使用情况,周、月、年展示图省略。如果想增大监控粒度,可以考虑监控inode节点数使用情况。因为节点数不够用也会报错。
1.2.1.4 网卡监控
主要监控网卡的流量,包括网卡的入数据流量和出数据流量
主要步骤和程序如下:
(1) 生成新的MRTG配置文件,通过local登录127.0.0.1,并依据网卡设备名进行数据流量统计,统计的时间轴从右到左推移,并以bit为单位,统计结果保存在/var/www/html中。
cfgmaker --global "WorkDir: /var/www/html" --global"Options[_]: growright,bits" --ifref=name local@127.0.0.1 >/etc/mrtg/mrtg.cfg
(2)通过mrtg.cfg配置文件生成用于http访问的页面文件mrtg.html。
indexmaker /etc/mrtg/mrtg.cfg > /var/www/html/mrtg.html
(3) vi /etc/cron.d/mrtg中输入以下内容
*/1 * * * * root LANG=C LC_ALL=C /usr/bin/mrtg /etc/mrtg/mrtg.cfg--lock-file /var/lock/mrtg/mrtg_l --confcache-file /var/lib/mrtg/mrtg.ok
(4)执行以下内容
LANG=C LC_ALL=C /usr/bin/mrtg /etc/mrtg/mrtg.cfg --lock-file/var/lock/mrtg/mrtg_l --confcache-file /var/lib/mrtg/mrtg.ok
该监控方法用于监控网卡的流量,然后通过mrtg把相应的数据绘画出来,形成图形。结果如图8-2-1-4-1所示。
图8-2-1-4-1
如图4-2-1-4-1所示,横坐标表示时间,纵坐标表示网卡的流量。其中绿色部分表示网卡的入流量,蓝色部分表示网卡的出流量。周、月、年的展示图省略。
1.3 短信报警
随着移动通信设备的普及以及自动化报警的需求,短信报警越来越重要。在企业级应用中,通过购买短信运营商,比如中国联通、中国移动、中国电信的短信网关服务器的服务再结合脚本程序完成短信报警。实际上短信网关服务器起到转换传输通信方式的作用。
1.3.1 短信报警实现
在企业级应用中,通过购买短信运营商的短信网关服务器的服务来转发短信,在下面方案中,我们使用139邮箱绑定手机号码,开通邮件提醒功能,同样实现短信报警。架构图如图8-3-1所示。
图8-3-1
如图8-3-1所示,节点C为被监控的服务器,节点B为监控系统的服务器,节点A为移动运营商的短信网关服务器。通过脚本程序从C得到监控数据,判读是否大于阈值,如果大于,则将报警信息作为内容通过B上的sendEmail软件将163邮箱作为发送方,发送邮件到139邮箱longxibendi@139.com,然后由于开通邮件短信提醒,移动运营商会将邮件信息转换为短信通过短信网关服务器发送信息到基站,最后传输到手机中。详细信息如下所述。
1.3.1.1 短信报警,监控CPU性能负载
CPU的性能指数,主要查看CPU最近的负载情况,因为CPU某一时刻的使用量达到很大值是可以接受的,但如果某一个时间段负载持续走高,那么CPU的性能以及整个系统的性能将会下降,甚至主机会宕机,停止服务。所以我们编写程序uptime.sh监控CPU负载情况,mail_uptime.sh对CPU的负载进行判断然后执行报警,最后通过cron任务设置执行程序的间隔时间来定时的监控CPU。因为测试原因,暂且把CPU在在一份之内的负载阈值设为0.01,如果超过此数值,则进行短信报警。代码如下。
(1)uptime.sh
#!/bin/bash
#author longxibendi
#blog http://blog.csdn.net/longxibendi
#function to get load
cat/proc/loadavg | awk '
( $1 >= 0.01 ) { print $0;}
(2)mail_uptime.sh
#!/bin/bash
#author longxibendi
#blog http://blog.csdn.net/longxibendi
#function to send mail if system load averages for the past 1 minutes greater than 0.01 .
#ERROR: if you write like this
######################ERROR##################################
##### iftest ! -z " ` sh uptime.sh `" ;then
if test! -z "`shuptime.sh`" ; then
/usr/local/bin/sendEmail-f monitor_sys@163.com -t longxibendi@139.com -s smtp.163.com -u "loadWarning" -xu monitor_sys -xp 123456789 -m " `uptime ` "
fi
1.3.1.2 短信报警,监控CPU使用量
使用程序mail_cpu.sh对CPU的使用量进行监控,CPU的使用量主要包括系统进程(线程)使用量和用户进程使用量。利用sar采集数据,进行判断。sar的一半采集结果如下:
sar–u 1 2
Linux2.6.18-194.el5 (localhost.localdomain) 06/13/2011
07:58:50PM CPU %user%nice %system %iowait%steal %idle
07:58:51PM all 1.000.00 2.00 0.000.00 97.00
07:58:52PM all 0.000.00 0.00 0.000.00 100.00
Average: all 0.500.00 1.01 0.000.00 98.49
程序mail_cpu.sh如下:
#!/bin/bash
#author longxibendi
#blog http://blog.csdn.net/longxibendi
#function email and SMS alert ifusage of cpu is greater than 1%
if[ `/usr/bin/sar -u 1 3 | grepAverage | awk ' { printf( "%d",$3+$5);}'` -ge 1 ] ;then
/usr/local/bin/sendEmail -f monitor_sys@163.com -t longxibendi@139.com-s smtp.163.com -u "cpu warning" -xu monitor_sys -xp 123456789 -m "` /usr/bin/sar -u 1 3 | sed-e '1,2d' -e '4,6d' `" ;
fi
程序mail_cpu.sh当发现cpu使用量超过1%时,进行短信报警。
1.3.1.3 短信报警,监控内存使用量
内存的使用量,是另一个反应当前服务器性能和负载的指标。使用free.sh对内存使用量进行采集,使用mail_free.sh对内存的使用量进行监控,实现短信报警。具体程序如下:
free.sh程序
#!/bin/bash
#author longxibendi
#blog http://blog.csdn.net/longxibendi
#function get the percentage of memory usage
fr="`free`";
free| grep Mem | awk -vf="$fr" '
($3/$2 >= 0.5) {print f ;}
'
unsetfr
mail_free.sh程序
#!/bin/bash
#author longxibendi
#blog http://blog.csdn.net/longxibendi
#function to send email to longxibendi@139.com ifthe percentage of memoryusage greater than or equal
iftest ! -z "`sh free.sh`" ;then
/usr/local/bin/sendEmail-f monitor_sys@163.com -t longxibendi@139.com -s smtp.163.com -u "memorywarnning" -xu monitor_sys -xp 123456789 -m "` sh free.sh| awk -va="****" ' { print $1,a,$2,a,$3,a,$4,a,$5,a,$6;}'`"
Fi
1.3.1.4 短信报警,监控磁盘使用量
主要对磁盘的分区使用量进行监控,通过程序df.sh对磁盘使用量进行数据收集,通过mail_df.sh对df.sh收集的数据进行分析,如果发现超过阈值,进行短信报警。设置的阈值为70%。即磁盘分区使用量超过70%进行报警。程序如下。
df.sh程序
#!/bin/bash
#author longxibendi
#blog http://blog.csdn.net/longxibendi
#function findwhich disk‘s Available amount less than20%
df -hm |awk '
( $3/$2 >= 0.7 ) { printf "%s\n" ,$0; }
'
mail_df.sh程序
#!/bin/bash
#author longxibendi
#blog http://blog.csdn.net/longxibendi
#function sendmail to longxibendi@139.com ifthe amount of available disk less than 20%
#if[ `./df.sh | wc -l ` >=1 ] ; then
if [ `./df.sh | wc -l ` > 0 ] ; then
/usr/local/bin/sendEmail -f monitor_sys@163.com -t longxibendi@139.com-s smtp.163.com -u "disk warning" -xu monitor_sys -xp 123456789 -m "`./df.sh | awk ' { print $5,$6}' ; date ` "
fi
1.3.1.5 短信报警,监控磁盘的读写速度
读速度监控以及短信报警,使用程序mail_io_read.sh。当发现磁盘读速度小于每秒100Blocks时,执行短信报警。程序如下。
mail_io_read.sh程序
#!/bin/bash
#author longxibendi
#blog http://blog.csdn.net/longxibendi
#function SMS and Email alertif IO error
if[ `/usr/bin/iostat | grep sda | head -n 1 | awk '{printf("%d",$3);}'`-le 100 ] ;then
/usr/local/bin/sendEmail -f monitor_sys@163.com -t longxibendi@139.com-s smtp.163.com -u "IO warning" -xu monitor_sys -xp 123456789 -m " `iostat | sed -e '1,5d' -e '8,21d'|awk -v a="||" '{print $1,a,$2,a,$3,a,$4,a,$5,a,$6;}
'`";
fi
写速度监控以及短信报警,使用程序mail_io_write.sh。当发现磁盘写速度小于每秒100Blocks时,执行短信报警。程序如下
mail_io_write.sh程序
#!/bin/bash
#author longxibendi
#blog http://blog.csdn.net/longxibendi
#function SMS and Email alertif IO error
if[ `/usr/bin/iostat | grep sda | head -n 1 | awk '{printf("%d",$4);}'`-le 100 ] ;then
/usr/local/bin/sendEmail -f monitor_sys@163.com -t longxibendi@139.com-s smtp.163.com -u "IO warning" -xu monitor_sys -xp 123456789 -m "`iostat | sed -e '1,5d' -e '8,21d'|awk -v a="||" '{print $1,a,$2,a,$3,a,$4,a,$5,a,$6;}
'`";
fi
1.3.1.6 短信报警,监控网卡的状态
提供网络服务器的服务器,必须有网卡,一旦网卡出现问题,如果只有一块出口网卡,那么预示着本机的服务也终止了。所以网卡的监控非常重要。下面使用mail_eth0.sh对网卡进行状态监控。程序如下。
mail_eth0.sh
!/bin/bash
#author longxibendi
#blog http://blog.csdn.net/longxibendi
#function SMS and Email alert
if[ `sar -n DEV 1 1 | grep Average | sed -e '2d' -e '4d' | tail -n 1 | awk'{printf("%d",$5);}'` -eq 0];then
/usr/local/bin/sendEmail -f monitor_sys@163.com -t longxibendi@139.com-s smtp.163.com -u "eth0 error" -xu monitor_sys -xp 123456789 -m "`date `" ;
fi
1.4 故障转移
故障转移是指,当一个节点或者一个服务发生故障,比如主机僵死,进程僵死之后,能够有相应的监控系统发现故障,并在较短的时间内启动备用机器,实现故障转移。这是保证大型网站的高可用性最为重要的措施和方法之一。故障转移有不同的几个级别,比如主机操作系统的故障转移,数据库的故障转移,应用进程的故障转移等。本节主要给出应用进程的故障转移,以检测Nginx进程为例。
1.4.1 WebServer故障转移解决方案
运行环境如图8-4-1所示。
图8-4-1
如图8-4-1所示,在IP:172.29.141.112和172.29.141.113上同时部署两个web server Nginx服务器,并且部署故障转移程序monitor_nginx程序互相监控对方的Nginx运行情况。当发现另一方的Nginx服务器停止之后,立刻更改本机IP为对方IP,发送短信报警然后启用本机的Nginx程序来提供服务。详细部署情况如下所示:
172.29.141.112 部署 Nginx 与 FastCGI(对外开放)
172.29.141.113 部署 Nginx 与 FastCGI(作为热备)
172.29.141.115 部署 MySQL(或者MySQL-Proxy)
1.4.1.1 monitor_nginx程序
monitor_nginx程序如下:
#!/bin/bash
#author longxibendi
#blog http://blog.csdn.net/longxibendi
#function failoverthe web server andsend message to SA
# send emailto longxibendi@139.com
function_sendEmail()
{
/usr/local/bin/sendEmail -f monitor_sys@163.com -t longxibendi@139.com-s smtp.163.com -u "web sever down" -xu monitor_sys -xp123456789 -m "` date ` "
}
# changeip address
function_change_ip()
{
/sbin/ifconfig eth0 172.29.141.112 broadcast 172.29.141.255 netmask 255.255.255.0 up
/sbin/route add-host 172.29.141.112 dev eth0
/sbin/arping -Ieth0 -c 3-s 172.29.141.112 172.29.141.115
###/sbin/arping is toadd arp list in172.29.141.115
}
# tostart local nginxweb server
function_start_nginx_server()
{
ulimit -SHn 65535
/usr/local/webserver/php/sbin/php-fpmstart
/usr/local/webserver/nginx/sbin/nginx
}
#main function
function_main()
{
while true
do
http_status_code=`curl -o /dev/null -s -w %{http_code} http://172.29.141.112/wordpress/`
# echo "$http_status_code";
if [${http_status_code} != 200 ];then
function_sendEmail ;
function_change_ip ;
function_start_nginx_server;
fi
#execute curl per3 seconds
sleep3
done
}
function_main;
1.4.1.2 monitor程序说明
程序说明:
unction_sendEmail发送email到139邮箱,报警
function_change_ip浮动更改ip,添加路由,修改db的arp表
function_start_nginx_server 启动本机nginx服务器,这一步也可以调整,如果本机的nginx已启动的话
function_main主函数,通过curl网址得到状态码
1.4.1.3 monitor_nginx程序算法
基本算法
1.通过curl检测故障
2.通过浮动修改(ifconfig)ip实现故障切换(failover)
1.5 主机节点监控(宕机检测与报警)
一台主机除了对其CPU、内存、外设、网卡进行监控报警,更需要对整个主机进行监控,这个监控报警主要是监控主机是否在运行。宕机对运维人员来说,最痛苦了。如何检测一台服务器是否还在正常运行,如果该服务器宕机,如何在第一时间监测到并通知一线运维人员进行维护,最大化减少损失。下面的程序monitor_down.sh就是解决上述问题。
1.5.1 monitor_down.sh程序
monitor_down.sh程序如下。
#!/bin/bash
#author longxibendi
#blog http://blog.csdn.net/longxibendi
#function pinga host andoutput to fileping_longxibendi.log
#ping destination
function_ping()
{
ping -c3 172.29.141.115 >ping_longxibendi.log
}
#downtimedetection and send email to SA
function_downtime_detection_AND_sendemail()
{
if ["`cat ping_longxibendi.log | grep Unreachable`" !="" ] ; then
/usr/local/bin/sendEmail -fmonitor_sys@163.com -t longxibendi@139.com -s smtp.163.com -u "Serverdowntime" -xu monitor_sys -xp 123456789 -m "`date;echo"172.29.141.115" ` "
fi
}
#mainfunction
function_main()
{
while true
do
function_ping ;
sleep2
function_downtime_detection_AND_sendemail;
sleep2
done
}
function_main;
1.5.1.1 程序说明
(1)通过function_ping,每隔4秒对 主机 172.29.141.115 进行ping 操作,(当然,如果主机172.29.141.115的防火墙,或者内过滤ICMP包,那么这个程序显然不能用)将输出重定向到ping_longxibendi.log 文件中。
(2)通过function_downtime_detection_AND_sendemail,每隔4秒,通过ping_longxibendi.log判断是否有没有ping通的迹象,如果有,则调用 sendEmail 邮件(手机短信)报警。
(3)监控间隔时间说明,可以将第一个sleep 改为150,第二个sleep改为150,这样每隔5分钟监控一次。
1.5.1.2 程序扩展
在上面的程序基础上,根据应用需求,进行相应的代码添加,可以实现故障转移、服务器切换功能。具体方法与8.4.1节类似。
1.6 MySQL数据库监控
数据库的重要性对企业来书,不言而喻,一旦数据库出现问题,上层的应用服务将不能进行。所以对数据库的监控报警至关重要。根据企业的应用不同,监控粒度也有所不同,比如,监控MySQL的运行情况,监控MySQL数据库的缓存使用情况,监控MySQL的查询线程使用情况等。实现MySQL运行状态监控报警程序mail_mysql.sh。
1.6.1 mail_mysql.sh程序
mail_mysql.sh程序如下。
#!/bin/bash
#author longxibendi
#blog http://blog.csdn.net/longxibendi
#function monitoringmysql
SS=`/usr/local/webserver/mysql/bin/mysql -uadmin -p12345678 -h 172.29.141.112 -P3306 -e "show databases;" 2> /dev/null`
if[ -z "$SS" ]; then
/usr/local/bin/sendEmail -f monitor_sys@163.com -t longxibendi@139.com-s smtp.163.com -u "MySQL Down" -xu monitor_sys -xp 123456789 -m "`date `";
fi
1.6.1.1 mail_mysql.sh程序说明
通过使用mysql –e 参数执行 mysql命令,(把错误输出重定向到/dev/null)如果得到结果,则说明MySQL服务器正常运行,如果没有得到结果,或者得到结果为空,则说明MySQL数据库有问题。发送短信报警信息。
1.6.1.2 程序扩展
在高可用的网站后台中,会用到MySQL的主从复制,这样如果发现主数据库出现问题,通过更改本程序,可以实现故障转移。基本方法与1.4.1类似。
1.7 本章小结
本章主要详细论述了三个问题:服务器的监控、报警与故障转移。通过shell程序结合mrtg绘图工具,实现了一个完整的监控主机的方案。通过shell程序结合网易和移动的邮箱服务,实现了一个完整的短信报警方案。通过shell程序实现了故障转移的方案。


发表评论

相关推荐
实时监控网站,网站故障报警提醒
怎么对大型网站进行监控,进行性能优化,怎么测量网站的故障,怎么进行故障排除,教给你方法,少走弯路,避免一些坑
温室室内光照度的远程监控报警系统,系统稳定性很好,可拓展
大型工厂监控报警联动解决方案.doc
消防监控报警(故障)处置单(样表27)页.pdf
网站服务器监控报警系统是一个独立的.NET服务,安装在您的服务器或者电脑上,能实时监控网络,出故障自动发邮件报警。安装和配置方法参见软件演示地址。网站服务器监控报警系统功能特点1、完全独立安装,独立使用。2...
本规范规定了规定了智能视频监控报警系统车载终端(以下简称终端)与监管/监控平台(以下简称平台)之间、车载终端与外设之间的通信协议,包括协议基础、消息定义及数据格式,对 JT/T 808-2013 《道路运输车辆卫星定位...
这是一款有关摄像控报警考勤报警通知系统,它集成了摄像监控、摄像报警、截取报警信息传输、 RFID拍照考勤、一体的摄像监控考勤软件,功能比较使用,感兴趣的朋友可以下载看看哦。 二、功能介绍 该源码的具体功能...
一个物有所值的、易用的基于web/...提供了许多监控功能,可以实时监视windows事件日志、windows服 务、线程、文件、性能计数器,包括处理器、内存和网络,监控逻 辑分区和页面文件的闲置空间,定义和计划自定义的监控点
实时监控报警系统程序功能:有友好界面、报警编号、报警时间、报警内容、是否出警、出境原因、输出出警及报警信息等等。
针对报警数据中真伪数据同存的问题,提出了煤矿安全监控系统联网报警数据甄别技术,介绍了监控设备误报警自动识别,传感器调校、"三闭锁"断电试验数据自动识别,传感器故障数据自动识别,人工实测与传感器监测数据对比...
内燃机车在线路上运行时发生牵引电机小...分析了牵引电机齿轮故障的原理,根据牵引电机齿轮所处的特殊位置,研制了一种新型的机车牵引电机齿轮故障监控报警装置,正确判断电机齿轮故障,及时提醒乘务员,保证机车安全行驶。
之软监控报警系统(16通道)
简要介绍了煤矿瓦斯监控的现状及发展方向,对煤矿瓦斯监控系统、瓦斯监控报警系统及工作原理进行分析,并根据实际煤矿生产情况,对煤矿瓦斯监控报警平台进行设计。
视频监控,如果有东西经过监控区域就语音报警,并且人机界面变为红色,并将经过者拍摄下来保存
防盗报警系统及监控报警联动功能介绍
Linux服务器下流量监控报警系统shell脚本实现.pdf
实战—阿里海量监控报警治理及应急实战.pdf
汽车制动故障智能监控报警系统研究.pdf
监控报警系统,之软监控报警系统(四通道) V4.0.12.132破解版